
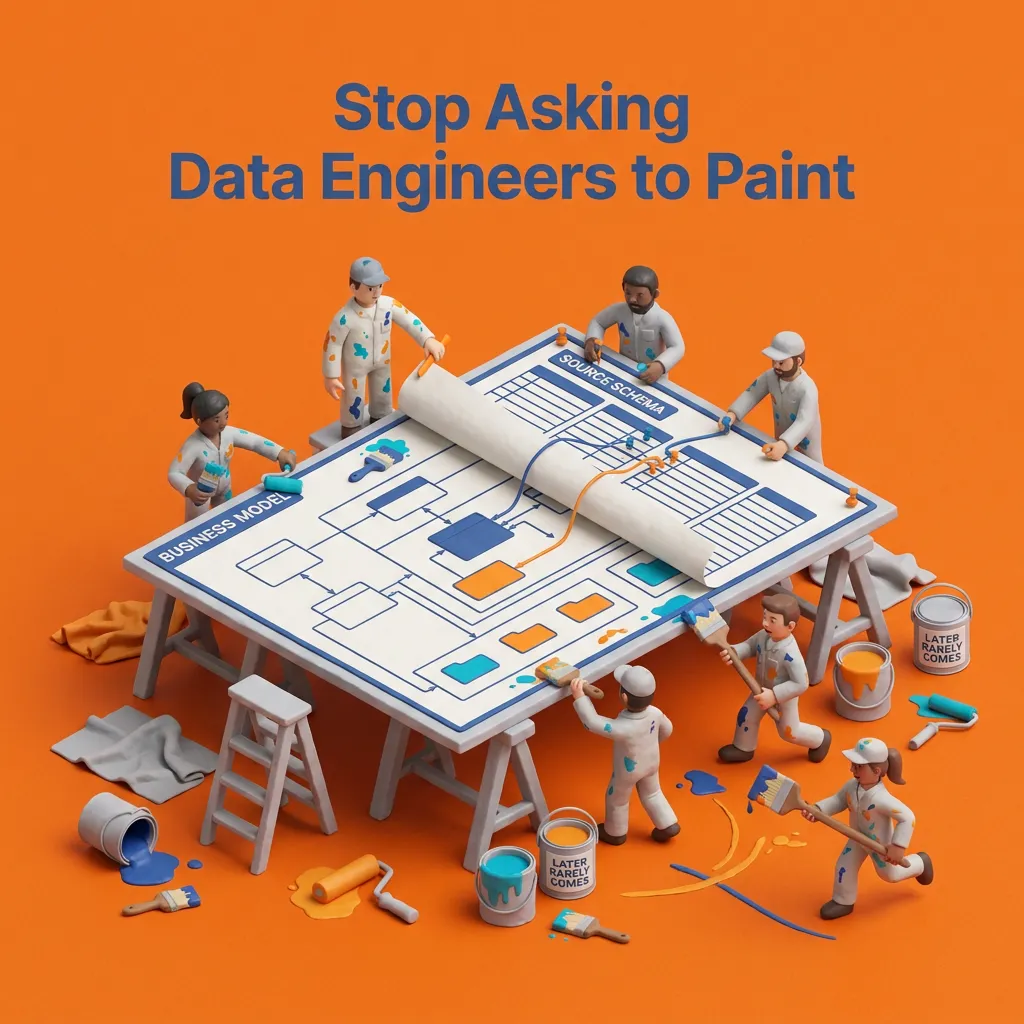
Stop Asking Data Engineers to Paint
The conceptual data model is the cleanest artifact on the project, and it usually survives right up until the first source system arrives.
If you have watched a data project start, you have seen the painting get made. Data modelers produce the beautiful diagram: entities laid out in clean ranks, relationships that read like sentences, the whole company rendered on a single page. That page earns its place because it states what the business means, and nothing downstream is trustworthy without it.
Then somebody connects a source, and the painting starts to crack.
The source does not care about your composition
The physical tables resemble that painting the way a warehouse resembles an architect’s watercolor. Keys are missing, one concept is smeared across four tables, and the column names mean nothing outside the vendor’s manual. Your engineers get handed both the painting and the warehouse, along with an instruction that sounds simple: make this look like that.
How, exactly? Nobody wrote it down. The rules that turn the source’s shape into the model’s shape were never defined, or they were defined once in a workshop and then lost in translation somewhere between the whiteboard and the backlog. Meanwhile the deadline says to land the data in the lakehouse, get people reporting, and model it properly later. Later rarely comes.
Engineers are not artists, and should not have to be
This is the friction that burns data projects. Your engineers work with facts: the schemas as they are, the constraints that exist, the data that actually arrives. What they are aiming at is something that functions. Your modelers want that something to be faithful as well, shaped the way the business thinks rather than the way the source happens to be laid out. Neither side is wrong. They are each holding half of the same object, in two different media, with nothing that lets them join the halves.
Calling that a people problem is the mistake, because it is a problem of medium. A model that exists as a picture cannot meet a schema, so every comparison between the two happens by hand, and every manual comparison is another place where meaning leaks out. A business model that cannot bind to a discovered schema is a poster.
How DeltaVault makes the conceptual data model a working surface
DeltaVault starts by changing the medium. Your business model lives as a live diagram inside the catalog, so you double-click the canvas to create an entity and drag between two nodes to create a relationship. Every stroke is real, versioned metadata rather than a box in a drawing tool, which turns the painting into a surface that other things can attach to.
The physical data model gets the same treatment from the other direction, because nobody was ever going to draw those diagrams by hand. DeltaVault reads them straight off the metadata instead. Select a schema and you get its entity relationship diagram (ERD), with key columns included and crow’s foot notation on the connectors. Open a project canvas and the tables lay themselves out along the dependency graph, each node tinted by its pipeline layer, so you can read the shape of the estate at a glance. Your engineers end up with the diagrams they were never going to produce, always current, at no effort to them.
You now have two working surfaces, one on each side of the gap. The model is metadata, the estate is metadata, and metadata can be joined.
That join is what the rest of this series is about. Part two covers the mapping, showing how each source table gets matched to the business entity it actually means, with AI proposing and a person deciding. Part three, Built, Not Painted, covers the construction, meaning what to do when the source genuinely does not hold the model’s shape and views have to bridge the difference.
So stop asking your engineers to paint. You do not need another data modeling tool that draws pictures. You need a model made of metadata. Give both sides a surface made of the same material, then read on to part two, where the two sides meet.
This post opens an argument that chapter 5 of The Data Lakehouse for Everyone finishes. The chapter takes a single mapping decision apart, names who owns it, and shows what it costs to leave it in somebody’s head instead of on the record: The mapping is the deliverable.